Have you considered using a diagram to explain the concepts in your thesis?
A diagram that explains concepts and their expected relationships is called a conceptual diagram, and it’s simpler than you think.
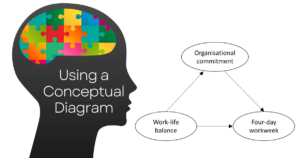
The image in this post shows a conceptual diagram of the relationship between three concepts: Work-life balance, Organisational commitment, and attitudes to a Four-day workweek (Roshan & Mehta, 2022).
It also shows that Organisational commitment mediates (or explains) the relationship between Work-life balance and attitudes to a Four-day workweek.
You can use a conceptual diagram in qualitative or quantitative research.
You could introduce it towards the end of your literature review to clarify your expectations.
Then you could build on it in your methodology chapter by showing how you will measure the concepts, and examine their relationships.
And later use it in your Results chapter.
There are many advantages to using a conceptual diagram:
It clarifies your thinking about the concepts you’re using and their relationships.
It helps the reader understand what you’re saying.
And supervisors and examiners love it! 
Let me know if you’d like help with your research.
Contact [email protected]
Thanks so much. Very helpful!
Glad I can help!